The purpose of this paper is to discuss the prospective impacts of such policy changes on the availability of milk for manufacturing. This will be accomplished by examining the trends in the availability of milk for manufacturing and the production of cheese, NDM and butter in 1980 and 1994. Next, farm level results will be analyzed under reregulation options of no price supports (no supports) as proposed in the House and Senate bills and no supports with order elimination as proposed in the House bill. The impacts of these two policy options were derived from price and macroeconomic projections for each option made by FAPRI. These impacts are believed to be quite consistent with similar estimates made by other university dairy analysts.
Both the trend and farm level analyses were conducted for six regions. These regions were proposed in one of the Freedom-to-Farm alternatives. They are believed to represent relatively uniform market areas from dairy supply and demand perspectives.
The rather simplistic approach of comparing two years of manufactured product production was taken because:
Figure 1 indicates milk production used for manufacturing in 1980 and 1994 regionally, in billions of pounds, percent of the U.S. total, and percent change (+ or -) in pounds over the period. In these aggregate production terms, the country divides into two, three-region segments. The Northwest (NW), California and Southwest (SW) regions nearly double more than double milk available for manufacturing. The North Central (NC), Northeast (NE) and Southeast (SE) regions each reduce production in the range of 10-20 percent. From a volume perspective, the reductions in the NC (4.9 billion pounds) and NE (3.2 billion) regions are particularly significant. These reductions in the face of relatively favorable milk and feed price policies raise important questions concerning how these regions might fare under deregulation.

Both the NC and SE regions decreased their share of national cheese production. Of particular note is the 13 percentage point decline in the NC region. However, this region still accounts for over half of the U.S. cheese production.


Western butter production (NW and CA) has increased to the point where it now surpasses that of the North Central region. The 18 percent decline in NC butter production, the home of Land-O'-Lakes, is probably the other noteworthy point from Figure 4. Yet the NC region still produces 36 percent of the U.S. butter supply. All other regions increased production, although their share of U.S. production each declined.

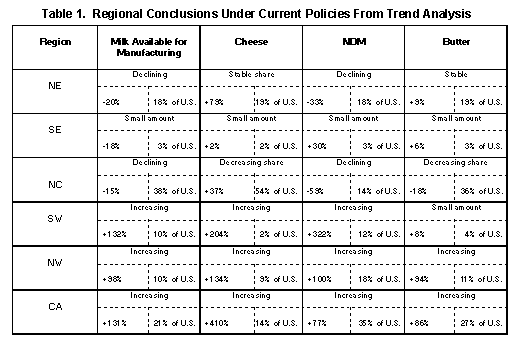
The relatively complex Table 1 attempts to summarize these trends on a single page. For the Northeast, it indicates increased specialization in cheese production while balancing fluid needs results in stable butter production. The SE is a small factor in manufacturing where balancing is a function fluid demands to serve a growing population. While the NC region represented approximately 30 percent of the 1994 U.S. milk production and 38 percent of milk utilized for manufacturing, it is in a state of decline. This decline is particularly apparent in NDM and butter. In cheese, while production in the NC region has increased by 37 percent, the share has declined by 12 percentage points to 54 percent -- still a majority of U.S. production.

The SW has received publicity for its relatively high Class I differentials and its rapidly increasing production. While the percentage increases are impressive for milk available for manufacturing, for cheese production and for NDM production, the shares are still relatively small. The question is whether this region can hold its production under deregulation.
Not surprisingly, the NW and California have experienced large increases in both absolute and relative terms. The magnitude of the increases are very significant. These increases are particularly astonishing with the realization that producer prices in these regions are lower than in the North Central region. Of substantial interest is for how long this magnitude of growth can be sustained.
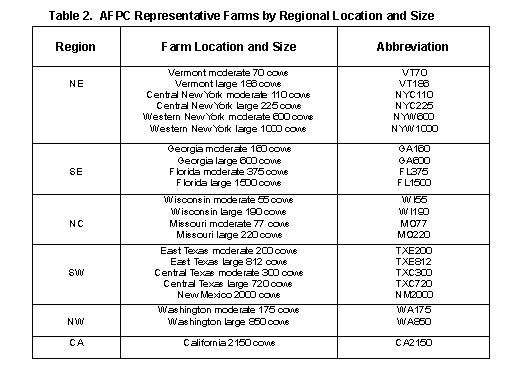
AFPC maintains a system of about 80 representative farms in major production areas throughout the United States, 22 of which are dairy farms. The locations of these farms are indicated in Figure 5. The number and size of farms in each location are indicated in Table 2. Each farm is abbreviated in subsequent tables by state and size as indicted in the right column of Table 2.


These 22 farms are developed by panels of producers as being representative of their region. The farms are simulated utilizing an accounting model that produces financial statements for the farm. These financial statements are approved by the panel as being representative of their operations prior to being utilized for policy analysis. Farms are updated with the help of the panel every three years. Most farms have now existed through at least three updates. In other words, they have been tracked over 10 or more years. It is interesting and important to note that several of the panel members for farms that have consistently simulated a low or negative net cash income have quit dairying -- gone out of business. This has given us a good deal of confidence in our panel procedures and simulation modeling activity.
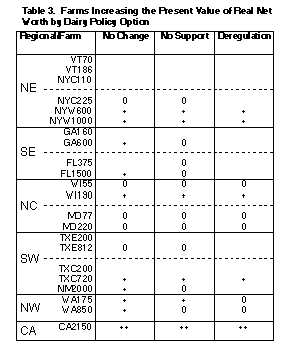
Table 3 provides a very simplified means of looking at our farm level results covering a number of analyses completed for the 1995 Farm Bill. The policy options include no change in policy (status quo), no support prices while maintaining federal orders (equivalent to the Senate proposal), and deregulation involving dropping both price supports and federal orders (equivalent to the House proposal). The symbols used in Table 3 should be interpreted as follows:

These farm level results indicate that even with no change in policy, moderate size farms in all regions are having substantial problems surviving. Both moderate and large Vermont farms lose equity under current policies. With no supports while retaining federal orders (Senate proposal), most farms in the SE and SW would either experience substantial stress or would only be able to hold onto their equity (not grow). Even in the NC region only the larger Wisconsin farm is able to sustain growth without supports. This indicates greater pressure for structural change in these regions than currently exists.
The deregulation option suggests substantial accelerated pressure for structural change in all regions except California. Production throughout the United States would shift decisively toward larger scale farms and/or exit the dairy industry. Regions continuing to experience real growth in equity but only on larger farms include Western New York, Central Texas, Wisconsin and California. It is important to note that large scale farms in both Florida and New Mexico lose equity in the absence of supports and federal orders. We view these deregulation results as representing best case scenarios. Our models are not able to capture the within year effects of price variability nor the potential for longer-term cut-throat competition associated with either handler pooling or extensive structural adjustment.
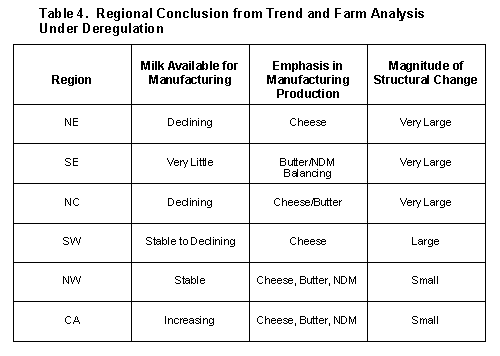
Table 4 attempts to combine and summarize the results of the trend and farm-level analyses under the deregulation scenario. It indicates that increased quantities of milk available for manufacturing are likely to develop only in California. California and NW are likely to produce all types of manufactured products. Structural change in this region will emphasize continued growth to larger size farms.

The Northeast will utilize declining milk supplies to specialize in serving fluid markets and cheese production. Most of the decline will be in New England and on smaller/moderate size farms in the rest of the region. Large farms such as those located in Western New York will tend to evolve and dominate the industry of the region.
The Southeast will restructure to serve the fluid market. Manufacturing will be related to performing the balancing function. Much of this manufacturing will be transported to other regions as is occurring with butter. It is possible that growing fluid markets will be served by new concentrated production areas removed from population centers and environmentally sensitive areas in Florida.
The North Central region will continue to experience declining production as it restructures to larger scale dairying. From a feed availability perspective, this region clearly has the ability to continue to be a major milk producing region. But a progressive "can do" posture of larger farms is required for the region to be competitive. Like the Northeast, this region will specialize in producing cheese. However, facilities and marketing firms will continue to be committed to producing butter, some of which will be supplied from other regions.
The Southwest has received much attention for its growth in milk and cheese production. Substantial new manufacturing investments in this region appear to signal continued growth in demand. However, all signs are not positive. New Mexico farms are experiencing higher feed costs resulting from exports of its high quality hay to dairies in Mexico. In Mexico and New Mexico, expanded hay production is limited by water availability. Growth in West Texas utilizing corn silage as roughage is possible but competes with large feedlots. Future milk production trends in what has been one of the most robust milk producing areas remains in question. Declines in production could be experienced with deregulation. Substantial structural change will continue in East Texas as it seeks a competitive strategy for producing milk in a traditionally dense milk producing area.
Three overall conclusions are warranted from this analysis under a deregulation policy scenario:
AFPC (Agricultural and Food Policy Center), Implications of the 1990 Farm Bill and FAPRI January 1995 Baseline on Representative Farms, AFPC Working Paper 95-1, Texas A&M University System, College Station, November 1995.
AFPC (Agricultural and Food Policy Center), Farm Level Impacts of the Senate and House Agricultural Reconciliation Provisions, AFPC Working Paper 95-20, Texas A&M University System, College Station, November 1995.
AMS (Agricultural Marketing Service), Federal Milk Order Market Statistics, Annual Summary, Dairy Divisions/AMS/USDA, Washington, D.C., 1980 and 1994.
CDFA (California Department of Food and Agriculture), California Dairy Industry Statistics, CDFA, Dairy Marketing Branch/Milk Pooling Branch, Sacramento, 1980 & 1994.
NASS (National Agriculture Statistics Service), Dairy Products Annual, NASS/USDA, Washington, D.C., 1980 and 1994.