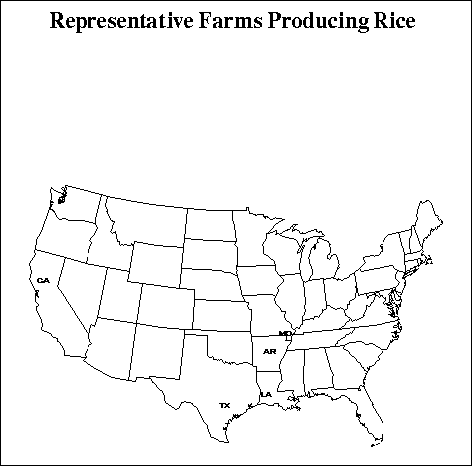
CHARACTERISTICS OF PANEL FARMS PRODUCING RICE
CAR424 a 424-acre Sacramento Valley California (Sutter and Yuba
Counties) moderate size rice farm that grew 400 acres of rice in
1994. The farm did not flex any crops and received all of its
revenue from rice.
CAR1300 a 1,300-acre Sacramento Valley California (Sutter and Yuba Counties)
large rice farm that grew 1,020 acres of rice in 1994. The farm flexed
the NFA rice base acres to idle and generated all of its revenue from rice.
TXR1500 a 1,500-acre West of Houston, Texas (Wharton County) moderate size
rice farm that grew 500 acres of rice in 1994. The farm flexed the NFA
rice base acres to idle and received all of its total revenue from rice.
TXR3900 a 3,900-acre West of Houston, Texas (Wharton County) large rice farm
that grew 1,300 acres of rice in 1994. The farm flexed the NFA rice
base acres to idle and received about 99 percent of its total revenue from
rice.
MOR1900 a 1,900-acre Southeastern Missouri (Butler County) moderate size rice
farm with 510 acres of rice, 650 acres of corn, and 740 acres of soybeans
planted in 1994. The farm flexed NFA rice base acres to corn and
generated about 44 percent of its total revenue from rice.
MOR4000 a 4,000-acre Southeastern Missouri (Butler County) large rice farm with
1,020 acres of rice, 296 acres of cotton, 1,040 acres of corn, and 1,600
acres of soybeans planted in 1994. The farm flexed NFA rice base to
corn and NFA cotton base acres to corn. The farm generated about 44
percent of its gross receipts from rice.
ARR1260 a 1,260-acre Arkansas (Poinsett County) moderate size rice farm that
grew 616 acres of rice, 109 acres of wheat, and 544 acres of soybeans in
1994. The farm did not flex rice or wheat. The farm flexed NFA and
OFA wheat acreage to rice. The farm generated about 76 percent of its
revenue from rice.
LA1100 a 1,100-acre Louisiana (Jefferson Davis, Acadia, and Vermilion
Parishes) moderate size farm that grew 500 acres of rice and 400
acres of soybeans in 1994. The farm did not flex rice to another
crop and generated about 81 percent of its revenue from rice.
Impacts on Rice Farms
- If the current farm program was continued, the average net cash farm
income for 6 of the 8 representative rice farms would be positive for the
1996-2003 period (Figure 9).
- With No Farm Program average annual net cash farm income over the
1996-2003 period is negative for 6 of the 8 rice farms (Figure 9). The
amount of risk associated with average net cash farm income over the period
1996-2003 is more than doubled for all of the rice farms (Tables D15-D18).
- The average net cash farm incomes over the 1996-2003 period, for 6 of the
8 rice farms is lower under the Marketing Loan Only scenario than the
Baseline (Figure 9). The relative and absolute variability in average net cash
farm income for 1996-2003 is greater for the Marketing Loan option than
for the Baseline (Tables D15-D18).
- Average changes in real ending net worth for the rice farms are negative for
all three policy options except for the Baseline option on the moderate size
Missouri farm (Figure 8).
- Based on the projected average net cash farm incomes and the changes in
real net worth, 6 of the 8 rice farms would prefer the Baseline over the
Marketing Loan Only option. The Marketing Loan Only option would in
turn be preferred to the No Program because of the loss in net cash farm
income and the increases in income risk associated with the No Program.
- Including risk in the farm level analysis resulted in the same policy
preferences between the Baseline and the No Farm Program options as
observed for the "normal" weather analyses. In the "normal" weather
analyses, the Marketing Loan Only scenario was preferred over the Baseline
by the two Missouri rice farms. Including the effects of risk makes the
Marketing Loan Only option preferred in Arkansas and Louisiana and not
preferred in Missouri. The large Texas rice farm indicated a marginal
preference for the Marketing Loan Only option over the Baseline, when risk
is included in the analysis. Overall, including risk did not change the
original rankings for these three policy scenarios.

