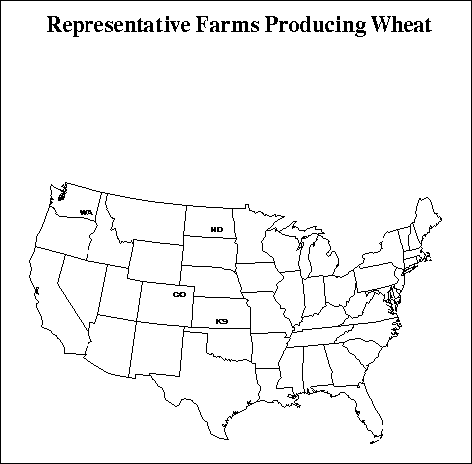
CHARACTERISTICS OF PANEL FARMS PRODUCING WHEAT
WAW1276 a 1,276-acre Southeastern Washington (Whitman County) moderate
size grain farm that grew 612 acres of wheat, 140 acres of barley, and
498 acres of dry peas in 1994. The farm flexed NFA and OFA barley
base acreage to wheat and generated about 66 percent of its revenue
from wheat.
WAW4250 a 4,250-acre Southeastern Washington (Whitman County) large grain
farm that grew 1,995 acres of wheat, 315 acres of barley, and 1,640
acres of dry peas in 1994. The farm flexed NFA and OFA barley base to
spring wheat and generated about 66 percent of its receipts from wheat.
NDW1600 a 1,600-acre South Central North Dakota (Barnes County) moderate
size grain farm that grew 860 acres of wheat, 340 acres of barley, and
400 acres of sunflowers in 1994. The farm flexed NFA barley to wheat
and received about 56 percent of its receipts from wheat.
NDW4000 a 4,000-acre South Central North Dakota (Barnes County) large grain
farm that grew 2,450 acres of wheat, 750 acres of barley, and 800 acres
of sunflowers in 1994. The farm flexed NFA and OFA to barley and
received about 65 percent of its receipts from wheat.
KSW1175 a 1,175-acre South Central Kansas (Sumner County) moderate size
grain farm that grew 1,100 acres of wheat and 64 acres of sorghum in
1994. The farm did not flex any base acres and generated about 95
percent of its total revenue from wheat.
KSW2800 a 2,800-acre South Central Kansas (Sumner County) large size grain
farm that grew 2,680 acres of wheat and 120 acres of sorghum in 1994.
The farm flexed 4.3 percent of wheat NFA to sorghum. Wheat
generated about 89 percent of the revenue on this farm.
COW2500 a 2,500-acre Northeast Colorado (Washington County) moderate size
grain farm that grew 1,100 acres of wheat and 300 acres of millet in
1994. Wheat generated about 80 percent of the total revenue on this
farm.
COW4000 a 4,000-acre Northeast Colorado (Washington County) large size grain
farm that grew 1,600 acres of wheat and 400 acres of millet in 1994.
Wheat generated about 85 percent of the total revenue on this farm.
Impacts on Wheat Farms
-
If the current farm program was continued, the average net cash farm income for
all representative wheat farms would be positive for the 1996-2003 period
(Figure 5). The level of average annual net cash farm income ranges from
$21,000 to $83,000 for the moderate size farms and from $56,000 to $140,000
for the large farms.
- With No Farm Program average annual net cash farm income over the 1996-
2003 period is negative for 5 of the 8 wheat farms (Figure 5). The coefficient of
variation for average net cash farm income over the period 1996-2003 is more
than doubled on each of the wheat farms (Tables D6-D9). For example the
moderate size Kansas farm (KS1175) experiences a decrease in net cash income
from $22,590 to -$12,750, and the coefficient of variation on the farm's average
net cash farm income increases from 38 percent to 85 percent (Table D8).
- The average net cash farm incomes over the 1996-2003 period, for all eight
wheat farms is lower under the Marketing Loan Only scenario than the Baseline
(Figure 5). The relative and absolute variability in average net cash farm income
for 1996-2003 is greater for the Marketing Loan option than for the Baseline
(Tables D6-D9).
- Average changes in real ending net worth for the wheat farms are negative for all
three policy options except for the Baseline option on the moderate size
Colorado (COW2500) farm (Figure 4).
- Based on the projected average net cash farm incomes and the changes in real
net worth, wheat producers would prefer the Baseline over the Marketing Loan
Only option. The Marketing Loan Only option would in turn be preferred to
the No Program because of the loss in net cash farm income and the increases in
income risk associated with the No Program.
- Including risk in the farm level analysis resulted in the same policy preferences
between the Baseline and the No Farm Program options as observed for the
"normal" weather analyses. However, in the "normal" weather analyses, the
Marketing Loan Only scenario was marginally preferred over the Baseline for the
Washington and North Dakota farms. Risk makes the Marketing Loan Only
option marginally less preferred in those two states, while making the Marketing
Loan significantly less preferred for farms in Kansas and Colorado.

