As indicated in Chapter 1, the analysis proceeded in two steps:
Chapter 1 set forth four criteria that any BFP option had to satisfy to be considered as a replacement for the M-W price series. These included:
The options analyzed fell into the broad four categories of competitive pay price, product price formula, economic formula, and no BFP (Table 1, Chapter 1). This section evaluates options in each of these four categories relative to the four criteria.
Competitive Pay Prices
The seven competitive pay prices that were analyzed included the M-W price series, an adjusted M-W (baseline) series, U.S. average Grade B price, the A/B price series, an adjusted A/B series, spot market for Grade A milk, and the futures price for milk used for manufacturing. Of these, only the two A/B price series survive the first step (Table 2).
M-W price series. The M-W price has a limited life. Some might suggest that it has already passed the limits of its useful life. Grade B milk production has fallen to 4.5 percent of the nation's milk production (6.9 billion pounds in 1995). In Minnesota and Wisconsin, Grade B production accounts for 8.9 percent of the milk supply (2.8 billion pounds in 1995). Figure 3 indicates that the trend in Grade B milk production, both in the United States and in the Minnesota-Wisconsin region, is consistently downward. Admittedly, a small share of the U.S. milk production will likely always be Grade B because certain facilities cannot be upgraded to Grade A standards. However, this reason for Grade B production will diminish over time as scale economies continue to make smaller dairies uncompetitive. Since questions exist regarding the reliability of the M-W today, these questions are sure to intensify over the next 10 years.
The M-W has benefitted from being understandable, in part because of the number of years that it has been used in setting Class III prices and ties to other class prices in all markets. Until 1992, it was applied uniformly throughout FMMOs for milk used in manufacturing. However, there is a question of the extent to which the M-W price reflects national as opposed to regional competitive conditions for milk for manufacturing. This question results from the perception that competitive conditions in the Minnesota-Wisconsin region may be unique due to a restructuring of farms in the region and excess processing capacity.
The M-W price generally is used as the standard against which its alternatives are compared, in part because farmers, processors, and policymakers are familiar with it. One problem with the M-W price is that it is not adjusted for hauling subsidies, which tend to be unique to Wisconsin. Nor does it account for protein premiums, which are particularly common in Wisconsin, although they also exist in Minnesota. For this reason, USC calculated an adjusted M-W price series, which adds to the M-W price series the average Minnesota-Wisconsin hauling subsidy and adjusts the milk price to 3.15 percent protein based on the prevailing protein test as reported by AMS/USDA. The hauling subsidies, protein content, and derived protein premiums (The formula utilized in five Midwest FMMOs was utilized to derive the protein premium). utilized to construct the adjusted M-W are reported in Table 3. Neither the hauling subsidy nor the protein content/premium are subject to audit. However, they are the best data available. USC believes that the adjusted M-W price provides a superior measure of competitive pay prices against which the M-W replacement options for the BFP should be evaluated.
Figure 4 and Table 3 compare the M-W price with the adjusted M-W price. The adjusted M-W averaged $0.12 per cwt higher than the M-W. Only in October and November was the M-W consistently higher than the adjusted M-W because the natural average protein test is much higher in the Fall months than the 3.15 percent standard.
In terms of the four criteria contained in Table 2, the adjusted M-W is evaluated in the same manner as the M-W price. That is, its life is no longer than the M-W and the extent to which it reflects the price of all products manufactured is questionable. Yet, it is believed by USC to be a superior measure against which to compare the remaining options to the M-W price. This comparison will be explicitly made in the text of this report for those options that survive this Step 1 analysis. Comparisons of each BFP option with the M-W and adjusted M-W price is contained in Appendix B.
Grade B price series. As an alternative to the M-W price series, it has been suggested that the U.S. average price for Grade B milk might be utilized as the BFP. The U.S. average Grade B price, its proponents suggest, would represent a broader U.S. market for Grade B milk that, therefore, would be more viably competitive. The Grade B price averaged $0.23 per cwt lower than the M-W price and $0.36 per cwt lower than the adjusted M-W.
USC questions the usefulness of the Grade B series as a substitute for the M-W price. While there are pockets of Grade B production in other parts of the country, there is no reason to anticipate that Grade B production in these regions is any more long-lived than in the Upper-Midwest. The number of buyers in most of these areas is known to be limited. In other areas, Grade B milk is a residual of milk that could not qualify for Grade A. With a limited number of buyers it is unlikely that the Grade B price would consistently reflect the value of milk for manufacturing.
USC concludes that adopting the U.S. average Grade B price as the BFP, at best, would be only a temporary solution. Figure 3 indicates that Grade B production is declining nationally in the same manner as it is in Minnesota and Wisconsin. While it is both understandable and geographically uniform, the Grade B price series has a limited life and does not reflect the market for manufacturing milk. Thus it does not survive Step 1.
A/B price series. The A/B price series was developed by AMS as a potential competitive pay price alternative to the M-W price series (Schmit, Sebastian and Halverson). It represents the average price paid for Grade A and Grade B milk used for manufacturing by cheese, butter and NDM manufacturing plants in Minnesota and Wisconsin. To arrive at this price, the amount of money these plants draw from the Federal order pool resulting from order sales at the Class I and II price is subtracted from the price paid Grade A producers by the manufacturing plants. (Arguably Class I and II over order premiums might also be subtracted from the price paid.) The A/B series consists of both plants participating and not participating in the pooling process.
The A/B price series has been the subject of considerable controversy as a substitute for the M-W price series. Having its origin in the Minnesota-Wisconsin region, the A/B price, like the M-W price, has been subjected to the argument that it is too high due to excess manufacturing capacity and structural change in the region. The A/B price averages $0.72 per cwt higher than the M-W price and $0.60 per cwt higher than the adjusted M-W price over the period 1991-1995 because of the quality, volume, protein and other premiums associated with Grade A milk and regional competitive conditions (Figure 5). Also, even though the pool draw is subtracted, there is competition among plants to attract Grade A producers who participate in the order benefits.
In contrast with the M-W price, the A/B price has a life beyond the elimination of a competitively viable market for Grade B milk. That is, over time, as the volume of Grade B milk declines, Grade A milk becomes a larger component in the A/B price series. In the event that Grade B milk disappears, the A/B series becomes a Grade A manufacturing price series. Therefore, the A/B series would be expected to have a life that substantially exceeds 10 years.
Except for the pool draw procedure, the A/B price should be as understandable as the M-W price and would be geographically uniform throughout the United States. Inasmuch as plants in Minnesota and Wisconsin compete for a milk supply in producing butter, NDM, and cheese, the A/B price reflects market conditions for all of these products. However, like the M-W price, it may give undue weight to unique competitive conditions in the Minnesota-Wisconsin region. For this reason, the A/B price is given a question mark regarding this criterion (Table 2). The A/B price survives step 1.
USC requested that AMS/USDA supply it with an A/B price series from another region, such as the Northeast. Its reason for this request included:
Adjusted A/B price series. As in the case of the M-W price series, an adjusted A/B series was developed that reflects hauling subsidies and protein premiums paid by manufacturing plants in Minnesota and Wisconsin. That is, estimated hauling subsidies were added to the A/B price and it was standardized for 3.15 percent protein, in the same manner as indicated in Table 3 (Appendix A).
Like the adjusted M-W is higher than the M-W price, the adjusted A/B price is higher than the A/B price (Figure 6) by an average $0.24 per cwt over the period 1991-1995. The adjusted A/B is $0.84 per cwt higher than the adjusted M-W, and $0.96 per cwt over the M-W price.
For those who judge the A/B price to be too high, the adjusted A/B price is even more so. Yet, like the A/B series, the adjusted A/B series would be expected to satisfy the criterion of a long life. It would be understandable and geographically uniform. Since it is generated in the Upper Midwest, it would be subject to the same regional questions as the M-W and A/B series. However, the adjusted A/B price might be used as a mover of the Class I and II prices if an option such as pooling differentials with no BFP were chosen. The adjusted A/B price survives step 1.
Spot Market Price for Fluid Milk. Bailey, a dairy economist at the University of Missouri, has suggested a BFP option involving regional auction markets for fluid milk shipments whereby processors and cooperatives would bid for milk delivered in three or four days. The prices would be FOB shipping point. Bailey argues that using such regional markets as the BFP would result in higher producer prices to the benefit of dairy farmers.
Spot markets have inherent appeal to economists because they are the epitome of marketplace supply-demand interactions. Even prior to the publication of Bailey's auction market option, USC had explored with AMS the potential for obtaining spot market fluid milk prices. Aside from the difficulty of obtaining a consistently comprehensive price series, USC concluded that spot market transactions usually only occur either in the Fall when supplies are short or in the Spring and around certain Holidays when there are substantial surpluses. Either period reflects unusual supply-demand conditions. In the Spring, milk is often sold on the spot market for unusually low prices when manufacturing plants reach capacity or when fluid plants milk receipts exceed bottling needs. While these sales may reflect the value of this milk in manufacturing, it does not reflect the value of all milk in manufacturing. Conversely, the Fall purchases are made primarily for Class I or II use with a substantial give-up charge price premium. While, arguably, this affects the value of this milk to a manufacturing plant, it does not reflect the value of all milk for manufacturing.
During times of the year when milk supplies are in relative balance in regions such as the South, there are not a sufficient number of spot sales to report a representative price. Even if such sales existed, the market would be so thin that it would be subject to manipulation.
The perishable nature of milk and the absolute requirement for a regular supply has consistently put a premium on a close working relationship between farmers and processors or between cooperatives and processors. Cooperative-processor procurement arrangements frequently take the form of full supply contracts. Therefore, Bailey's regional auction markets could be anticipated to be at least as thin as existing spot market sales and continue to be concentrated either in the Spring or Fall.
From material available to USC, it is not clear whether Bailey's intent was to utilize the auction market prices in setting the BFP on a regional basis or to average them in computing a national average BFP. In any event, this proposal fails to pass the Step 1 test.
Futures Markets
In June 1993, the Coffee, Sugar and Cocoa Exchange (CSCE) introduced futures and options contracts for cheddar cheese and nonfat dry milk. On December 12, 1995, the CSCE began trading Grade A raw milk futures and options. The Chicago Mercantile Exchange (CME) began trading Grade A futures and options on January 11, 1996. Theoretically, this Grade A futures price quote could be used as the BFP. Both the CSCE and the CME futures contracts were structured to price Class III milk in federal milk marketing orders. Therefore, we examined the Grade A raw milk futures contracts.
The futures contract for both exchanges calls for the delivery of a tanker load (50,000 pounds) of Grade A milk with a 3.5 percent butterfat content. A major distinction between the CSCE and the CME Grade A raw milk contracts is the delivery point. The CSCE contract requires delivery from an approved plant or facility in the Madison, Wisconsin district of the Chicago Regional Federal Order. The buyer is responsible for picking up the shipment and assuming all transportation costs from that point. The CME requires delivery to a CME approved facility within the borders of Wisconsin and Minnesota or located in that portion of surrounding states included in the Chicago regional or Upper Midwest Federal Milk Marketing Orders. The seller assumes all transportation costs to the buyer's facility except that the buyer will be assessed a standard freight rate per mile for each additional mile the milk is hauled over and above the distance between the seller's facility and either Eau Claire or Fond du Lac, Wisconsin. The excess hauling cost will be paid to the seller. But under both exchanges, deliveries of milk are subject to Federal order pricing rules.
The delivery months also differ between the two exchanges. Initially, the delivery months on the CSCE were February, April, June, August, October and December. But now the CSCE lists the additional delivery months of January, March, May, July, September and November. Hence, there is a Grade A raw milk futures contract listed for every month of the year. This is essential if the futures contract price is to replace the monthly announced BFP. The CME, however, only trades the delivery months of February, April, June, July, September and November.
The intent of the Grade A raw milk futures was to reflect the Federal Order Class III price. However, the M-W is a price for Grade B milk used in manufacturing. Only Grade A milk may be delivered under FMMOs. As seen with the A/B price series, the value of Grade A milk used for Class III (manufacturing) is generally higher than the Grade B M-W price.
Under the CSCE futures contract, with delivery points in the vicinity of Madison, eligible plants would not likely be willing to supply milk for delivery at the M-W price. The cost to acquire milk for delivery would be at least the Grade A cost to the plant for Class III milk use. Plants may demand even more since the unanticipated reduction in supply would disrupt manufacturing schedules and cause the plant to operate at reduced input levels. (Grade A manufacturing plants typically negotiate substantial give-up charges for spot sales of milk for diversion to fluid use.) Therefore, plant give-up changes, at least in parts, are the opportunity cost of not having that milk. If these added costs are reflected in the futures price, then the CSCE milk futures price would be expected to exceed the M-W price by the amount necessary to induce delivery from Grade A manufacturing plants. Of course, in reality, most contracts would be offset rather than delivered upon. But, nevertheless, the futures contract price can be expected to exceed the M-W price.
The CME contract price could be affected in a different way. The CME contract specifies plants regulated under the Chicago and Upper Midwest Orders as destinations for delivery. The milk may originate from eligible Grade A plants anywhere in the United States. This raises the possibility that the CME Grade A raw milk contract will price "distressed" milk, i.e., milk volume that temporarily exceeds plant capacity in some region. Distressed milk moving to Wisconsin for manufacturing typically sells at a discount to the M-W price.
Since trading of Grade A raw milk futures has been in existence only since December 12, 1995 on the CSCE and January 11, 1996 on the CME, historical trading data are limited to verify its pricing behavior. Further, contract volume and open interests, although increasing each month, are still low. Figure 7 indicates the daily close on Wednesdays of each week for a given futures delivery month on the CSCE and the announced M-W for that same month. The difference between the daily close and the M-W would be the nearby basis (the difference between the cash market price and the futures price).
In a well behaving futures market, the basis should be relatively stable with the futures and cash price moving more closely together throughout the contract. As can be readily seen, the daily close for the February milk futures was in the range of $0.14 to $0.44 per cwt under the M-W, that is, a positive basis, from December to early February. But then the daily close moved $0.16 to $0.47 per cwt over the M-W. The last day of trading for the February contract was February 21 where the nearby basis was -$0.16 cwt. Trading for the April contract started on February 28. From then until March 27, the daily close was below the April M-W, but in April and until the last trading day for the April contract, the daily close was $0.11 to $0.81 higher than the April M-W. Hence, the relationship between the daily close and the M-W during the last few weeks of trading for both the February and April contracts was closer to what was anticipated, that is, the daily close reflecting the Grade A price for manufacturing and higher than the announced M-W. But the situation was much different for both the June and August contracts. The daily close moved well above the M-W. The daily close for the August contract was as much as $2.00 to $3.60 per cwt above the August M-W, a price relationship much higher than the expected premium paid for Grade A milk for manufacturing over that of the Grade B/M-W price.
Figure 8 shows the daily close in relation to the M-W price for the CME. The delivery months shown are February, April, June, July and September. The relationship between the daily close and the M-W was similar to that experienced on the CSCE except that the daily close was below the M-W for the entire trading period of the February contract and for the April contract until the last week of trading. This positive nearby basis reflects, as anticipated, a CME contract price at a discount to that of the CSCE.
Table 4 compares the daily close for the CSCE and CME for the comparable delivery months of February, April and June. Except for a few exceptions, the CME contracts traded at a discount to the CSCE. But, as with the CSCE, the daily close on the CME moved well above the M-W price for the June, July and August delivery months. Equally important, the difference between the CSCE and CME prices should only reflect the value of the differences in the terms of the two contracts. Arbitrage between the two markets should make this difference relatively stable, which obviously is not the case. This is evidence of an unreliable futures market.
USC concludes that the Grade A raw milk futures on both the CSCE and CME were not reflecting the value of Grade A milk for manufacturing use. Rather, they were reflecting the value of spot shipments of Grade A milk from Grade A plants regulated under the Chicago Regional Order to the deficit fluid markets. Adding the Chicago Class I differential plus a plant give-up charge would result in a Grade A price for these spot shipments of $2.00 to $4.00 per cwt higher than the announced M-W price. This situation has occurred in the past during the summer when spot shipments of milk have taken place. Once the milk supply of Grade A milk produced in the Southeast improves to meet regional Class I needs and spot shipments from Wisconsin cease, the relationship between the daily close and the M-W will likely return to a situation similar to what was experienced for the February and April contracts, that is, the daily close will be more of a reflection of premiums being paid for Grade A milk used in manufacturing.
The above situation is a limitation of the Grade A raw milk futures as a replacement for the M-W. During periods when spot shipments of Grade A milk are not occurring, the daily close appears to reflect the competitive value for Grade A milk used for manufacturing in Minnesota and Wisconsin. But during periods when spot shipments of Grade A milk are occurring, the daily close is more reflective of the value of Grade A milk shipped from Wisconsin to other markets for fluid use.
It has been proposed that the M-W replacement be a weighted average of the prices (weighted by volume at each price) of all executed transactions that occur each day (except for the last trading day) during the calendar month in which the contract expires. For example, the August BFP would be determined by the weighted average of all transaction prices for the August contract on every trading day in August through August 19, 1996, the day before the last trading day for the August contract. The last trading day is eliminated because it is possible that in an effort by some futures trading participants to avoid making delivery or accepting delivery, they will liquidate on the last day, and prices on the last trading day can infrequently become distorted. (It is the delivery requirement that forces the futures and cash price to converge.)
As an illustration of this approach, the average of the daily closes weighted by volume of trading for each trading day, except the last trading day, for the delivery contract months of February, April, June and August on the CSCE were calculated. The resulting average for the month would be the BFP under the futures option. For February, the weighted average of closes was $13.88 per cwt, $1.29 higher than the February M-W of $12.59. For April, the weighted average of closes was only $0.06 per cwt higher than the April M-W; for June the $15.23 weighted average of closes was $1.32 higher than the M-W; and the August $18.52 weighted average of the closes was $3.58 above the M-W. Because of the low volume that has existed up to this point, the weighted average of the closes resulted in an unrealistic BFP.
As volume of trading improves, the futures option could become a valid price mover with no one transaction unduly impacting the calculated BFP. Such prices would be competitively determined with buyers and sellers of all types and geographical locations participating in the futures market. There would be the potential of more participants determining prices than what exists in the cash market. Under these circumstances, a daily weighted transaction price could be announced and then a final weighted average for the contract month could be derived. This procedure would provide some advanced pricing information to Grade A manufacturing plants regulated under FMMOs. Since futures markets are under constant surveillance by the Commodity Futures Trading Commission, and the Exchange's own by-laws, rules and regulations to ensure conformity and contract performance, the integrity of the market would be protected. The futures markets would offer daily public reports of prices electronically. Since buyers and sellers nationally may be participants in the futures market, futures prices are determined nationally. (Futures prices are not only national in scope but they also have international competitive dimensions embodied in them in that traders in futures may readily be located outside the United States.) Moreover, the futures market derived BFP would reflect the value of Grade A milk in the current month in comparison with the M-W price which is based on the price for Grade B milk for the previous month, updated with product prices.
In terms of the criteria indicated in Table 2, dairy futures have the potential for being long lasting, providing that trading volume continues to increase, assuring the survival of Grade A raw milk futures. Pending such increases, USC finds the futures option to have a questionable life at this time.
Dairy futures are not well understood by most dairy producers, and by many buyers and sellers of milk and dairy products. This understanding will improve with more use of the contracts. The futures market option is no more complicated or less understandable than what exists with the M-W or A/B BFP alternatives. However, the issue of understandability should not be trivialized. Extension economists who teach futures to cattle and grain producers indicate substantial frustration over the lack of basic understanding of futures versus cash markets. There are commodities where futures trading has existed for many years. It is obvious from the experience of other commodities that dairy farmers will not understand futures markets from mere participation in a dairy marketing club in their local neighborhood. Study and use is required. Therefore, at this point in time, USC considers producer and processor understanding to be questionable.
The futures BFP would be geographically uniform. However, we find that a Grade A raw milk futures determined BFP would fall short of reflecting supply and demand conditions in manufactured product markets. During times of spot shipments of Grade A milk from Wisconsin south, the futures prices appear to be a reflection of these spot prices for Grade A milk used for fluid purposes. In the Spring of the year, futures prices might be expected to be a reflection of surplus milk supplies sold at distress prices. Therefore, futures do not meet the Step 1 criteria.
Product Price Formulas
Twenty-two product price formulas were analyzed in this study (Table 5). These formulas fall into three product categories:
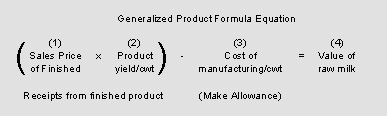
The generalized product formula equation involves computing the finished product receipts from a cwt of milk and subtracting the cost of manufacturing (make allowance) to arrive at the cost of raw milk (BFP). A detailed discussion of the make allowance issue as related to product formula pricing is contained in Appendix E.
Product prices were obtained from the same sources as assumed by the 1991 study:
Product yields per cwt were computed on either an annual basis or seasonal basis. Annual yields from a cwt of milk were assumed to be the same as those utilized by the 1991 study:
Make allowances per cwt were obtained from three different sources:
Weighting of products by use was done for butter/powder-cheese formulas. Use was measured on a nonfat solids and milk fat basis utilizing the same annual yields as in the product formulas. Table 7 indicates the change in the mix of manufactured products over the 1991-95 time period.
Butter/Powder Formulas
Product formulas that utilize only the prices of the butter and NDM product components are referred to as butter/powder formulas. The product formula assumes that 100 pounds of milk, 3.5 percent butterfat, 4.27 pounds of butter and the yield of NDM is adjusted on either an annual or seasonal basis as is indicated by the specific formula. Product prices used to compute processors' gross receipts included the Grade AA Chicago wholesale butter price and the Central State Area NDM price. (Questions regarding the quality of product price data will be discussed in Chapter 4.) Make allowance alternatives that were subtracted from the processors' gross receipts included the price support allowance, a derived allowance and a California plant cost allowance.
All of the butter/powder formulas would be expected to have a long life since the product price, yield and cost components could be obtained from plants either voluntarily or under compulsory order provisions. Likewise, all butter/powder formulas should be understandable. It is assumed here that any product formula pricing would be uniform throughout the United States because of the national nature of the market. In the interest of maintaining a minimum price structure, the price of butter and NFD milk could be derived from plants located in the larger lower-priced markets such as the Northwest, California, or Wisconsin.
There is no assurance that a butter/powder formula will accurately reflect market conditions for all manufactured products -- particularly not cheese. While it might be argued that interactions between the cheese, butter and NDM price assure that if the price of one (cheese, for example) is high relative to the butter and NDM price, capacity will be attracted away from butter and NDM. However, this attraction will be lagged and will be most likely to occur if the difference between the raw milk price and the finished product price is changing as a result of this interaction. Consequently, one can conclude that more immediate price responsiveness could be obtained by including cheese within the formula. The conclusion drawn is that none of the butter/powder formulas survive the Step 1 analysis.
Cheese Formulas. Product formulas that utilize only the price of the cheese product component are referred to here as a cheese formula. Obviously, there are many different types of cheese. In this analysis, USC utilized cheddar and assumed a yield of 9.87 pounds of cheese per cwt of milk. This yield, of course, changed with the protein content of the milk. Therefore, an adjustment was made in the M-W price for changes in protein on either an annual or seasonal basis, depending on the specific formula. The National Cheese Exchange 40 pound cheddar cheese block price and for whey butter and the Chicago Mercantile Exchange Grade A butter price were used. As for the butter/powder formulas, make allowances were based on the price support program, a derived allowance or California plant costs.
The application of the step 1 criteria to the cheese formulas led to the same results as for the butter/powder formulas. That is, all six formulas have the potential for a long life, all have the potential for being understood, all could be uniformly applied throughout the United States, but none of them would reflect the full scope of the manufactured product market. For the same reason discussed above regarding the inclusion of cheese as a factor in pricing milk for butter-powder usage, more immediate responsiveness can be obtained by including butter and NDM within the cheese formula. Yet, it is recognized that all analyses indicate a high correlation between the price of cheese and the M-W price. The conclusion is drawn that none of the cheese formulas survive the step 1 analysis.
Butter/Powder-Cheese Formulas. Product formulas that utilize the prices of butter, NDM and cheese are referred to here as butter/powder-cheese formulas. These formulas simply are a combination of a butter/powder and a cheese formula, with prices and yields as described above, weighted by the production of these products in milk equivalent, as indicated on either Minnesota and Wisconsin production or on U.S. production.
All of the butter/powder-cheese formulas satisfied the criteria of long life, understandability and geographic uniformity. Only those formulas with a derived make allowance failed to reflect market conditions for all manufactured products. Earlier in this chapter, it was indicated that the derived make allowance is highly variable, having neither a relationship to processing costs nor reflecting any trend (Figure 10). That is, while over time milk prices reflect product prices, this occurs with time lags.
A butter/powder-cheese formula with the price support make allowance also would not reflect changing market conditions because of its lack of updating relative to manufacturing costs. However, since USC lacked a sound national cost measure, it decided to retain the price support based formulas for the second more rigorous step in the analysis.
It was concluded that six butter/powder-cheese formulas survived the step 1 criteria in that they reflect the prices of all manufactured products, have the potential for a long life, are understandable and can be made to be geographically uniform. Figures 11-16 provide comparisons of the surviving butter/powder-cheese formulas with the M-W and adjusted M-W prices.
Economic Formulas
Economic formulas utilize those factors expected on the basis of economic theory to influence the supply and demand conditions for milk used for manufacturing (other than product prices). We divide such formulas into three categories:
Cost of Production Formulas. It is often asserted that farmers are simply interested in being assured of receiving their cost of production plus a reasonable profit. The result is the suggestion that the price of milk should either be set on the basis of cost of production or that cost should be a mover of milk prices from current levels.
Cost has always been a statutory consideration in the pricing of milk. Early in Section 2, the AMAA declares the pricing objective of the Act is the achievement of parity prices (AMS/USDA, 1990). The concept of parity pricing argues that the prices of all agricultural commodities should move in concert with inflation in costs as reflected in the prices paid by farmers relative to an historical base. Parity ran into problems and has since been abandoned as a farm bill goal. Although the AMAA still contains reference to the parity objective, in Section 8c(18) it recognizes that there are conditions where parity prices are not reasonable.
Parity generated high milk prices that brought forth excess production because it was based on changes in agricultural input costs, it failed to reflect changes in technology that resulted in higher milk output per cow, it did not reflect reduced costs resulting from larger size farms, and it failed to adjust to changes in demand. Parity was never commodity specific. Therefore, when parity was used, the support price for milk reflected changes in the price paid for all agricultural inputs. The concept of dairy parity was discussed as a BFP alternative (Milk Pricing Advisory Committee, 1972, p. 7) but was rejected on the grounds that even if it was dairy specific and declined as milk output per cow increased, it could not be depended upon to adjust when either excess supplies or deficit conditions developed.
While parity may not be a feasible pricing objective, reflecting changes in costs is still a relevant consideration in milk pricing. Section 8c(18) of the AMAA suggests a balancing of factors affecting supply and demand including adjusting milk prices to reflect the price of feed and available supplies of feed (AMS/USDA, p. 22). While tying the price of milk to the cost of producing milk on a per cwt basis would reflect factors affecting the supply of milk, it would not automatically adjust prices when surpluses or deficits developed.
While cost of production concepts have had a long life, are understandable, and could be applied uniformly across the United States, they would require constant adjustment because costs only reflect supply conditions operating in the market -- not demand conditions. Therefore, market conditions for manufactured products would not be reflected in the price of milk. In summary, the cost of production alternatives fail to pass the step 1 tests (Table 8).
This conclusion may appear to run contrary to California's use of a relatively sophisticated producer level cost accounting system in pricing milk for many years. The answer lies in their willingness to utilize unit costs to move the price of Class I and Class II milk in both an upward and downward direction and the fact that if a mistake is made in pricing milk, the U.S. market has absorbed the shock of greater manufactured product production. Without the U.S. market as a supply-demand shock absorber, the warts on the California cost-based pricing system would be more apparent. (The California system of milk pricing is discussed in greater detail by Cropp and in Appendix E.) Even so, California discontinued adjusting its producer pay prices by a cost of production index in 1994 and now adjust the milk price by a commodity reference price index.
Econometric Dairy Models
Mathematical and statistical models that are designed to quantify and explain the forces affecting supply and demand are referred to by USC as econometric dairy models. The ability of economists to model dairy markets by product, over time and geographically, is constantly improving. Yet, most of these models utilize annual data as the basis for analysis. Methodological and analytical results from these models are in three basic forms:
Price Snubbers
The addition of an economic variable to alternatives such as a product price formula is referred to as a price snubber. The snubber adjusts the price to reflect the added economic variable. Two types of snubbers are discussed here because of their potential for improving the performance of another pricing option:
Feed Cost Snubber. The alternatives discussed thus far are often criticized in that prices do not respond sufficiently rapidly to changes in costs of production. At the extreme, costs may be rising while prices are falling. Such was the case in 1995. Since feed costs constitute approximately half of milk production costs, questions arise as to whether it might be possible to add a snubber to the price of milk generated by a product price formula or a competitive pay price that reflects changes in cost of dairy feed relative to the previous month. The snubber would need to work in both an upward and a downward direction. If such a snubber had been in operation in 1994-95, the fall in prices in 1995 could have been slowed while the dramatic runup to record prices in 1996 could have been dampened.
USC developed a feed cost snubber option to the butter/powder-cheese formula having seasonal yields, weighted by U.S. production, and utilizing the California make allowance. The essence of the snubber, which is explained in detail in Appendix F, involves adjusting the price of milk for changes in feed costs based on a three year moving average of the monthly milk feed price ratio.
Specifically, changes in feed costs were estimated on a monthly basis over the period 1991-95 for a 100-cow dairy having an average daily output per cow of 52.5 pounds at 3.5 percent milkfat. The feed ration was balanced to include corn, soybean meal and alfalfa. Corn and soybean meal prices were based on the Chicago market. Hay prices were based on the AMS Kansas and Nebraska grinding hay quote which appears to be the industry standard. The product formula price was adjusted when the monthly milk/feed price ratio changed by more than one standard deviation from the 36 month moving average. The BFP was adjusted to bring the milk/feed price ratio to the 36 month moving average price.
Figure 17 provides a comparison of the snubbed butter/powder-cheese formula with its previously discussed unsnubbed counterpart, the M-W price and the adjusted M-W price.
The snubbed butter/powder-cheese formula would neither add to nor subtract from the life of either of the cost options analyzed. Since farmers are very aware of what is happening to their costs, this option should be understandable to them. This snubbed formula could be applied in a geographically uniform context. It would still reflect manufactured product market conditions, although more weight would be given to what is happening on the supply (feed cost) side of the market. Therefore, this snubbed formula survives the step 1 criteria.
Stocks Snubber. Previously, it was concluded that a cost of production formula did not satisfy the step 1 criteria of the need to reflect product market conditions because demand and stocks are not considered. Moreover, estimates of monthly changes in costs of production do not exist. If there were monthly production costs, a stocks snubber would hold the potential for remedying this deficiency. The stocks snubber could adjust prices upward when stocks were below a normal range and downward when stocks were higher than normal. The snubber could set a normal range for the milk equivalent of total stocks, or for each individual product. The effect of such a snubber would be to reflect the interrelation of supply and demand pressures. In part, it reflects the frequently stated notion that any economic formula will work as long as there is a sufficiently powerful stocks snubber.
The key to making a cost of production formula work is a well constructed stocks snubber. USC analyzed this issue sufficient to conclude that normal stock ranges are as follows:
Many problems are presented by the absence of monthly costs of production and difficulty of obtaining accurate cost indicators other than feed. Utilizing representative farms as an analytical tool is a possibility. The existing representative farm models are annual and could be used to estimate monthly costs only if they were modified. Despite the existence of the stocks snubber, this option would give primary weight to costs of production. Therefore, it is doubtful that supply-demand conditions would be adequately reflected in the BFP. Moreover, the stocks snubber would likely have to be constantly adjusted raising questions regarding the long-life criteria. Then too, while producers understand costs, they have more problems understanding stocks and their relationship to price. Therefore, the cost of production option with a stocks snubber did not survive the step 1 criteria and was not analyzed in further detail. USC concludes that the feed cost snubber is a more workable option for reflecting costs changes.
No BFP
The final option category is to have no BFP. This option asserts that while Class I and II milk may still require regulation to assure orderly marketing, the price for milk used for manufacturing would be unregulated -- it would be set by competitive market forces. We analyzed two options that fall in this category:
Pricing Components With No BFP. In this option, the government does not set a minimum price for milk used for manufacturing. Government's role instead sets uniform minimum component prices/values presumably based on transaction or exchange/spot market prices. It then audits plants to provide assurance that producers are properly paid consistent with the established component pricing procedure. It is, of course, still possible to calculate a benchmark price per cwt of milk for manufacturing which could be used to evaluate the performance of this option and could also be used as a mover for Class I and Class II pricing.
Component pricing is not new to FMMOs. Eleven FMMOs had component pricing provisions incorporated into the order provisions in January 1996. (Agricultural Marketing Service, May 1995). In addition, there are many industry component pricing programs.
The steps and assumptions made by USC in valuing the three major milk components include:
Applying the step 1 criterion, pricing milk components with no BFP would have a long life. Its understandability is debatable and, therefore, warrants a question mark. However, with increased use of component pricing in FMMOs, an increasing number of producers are developing an understanding of this type of pricing option. With no BFP, pricing components with no BFP would not result in a geographically uniform BFP. However, the procedure for pricing components could be uniformly applied to assure fair producer treatment. The option would reflect the value of milk for manufacturing in that the price received by producers would be the result of competitive market forces for all manufactured products in a supervised market environment to assure fair producer treatment and equity.
In evaluating step 1 survival, this option is inherently different than the others because there is no BFP. The component values would be uniformly applied in all FMMOs. Therefore, this option survives the step 1 analysis.
Pooling Differentials With No BFP. This option also assumes that there is no longer a need for a basic formula price or that all other options are deemed to be worse in terms of their performance or regulatory costs imposed. Under this option the regulatory tie between the price of milk used for manufacturing and higher valued milk classes would presumably be severed. Manufacturing plants would be free to pay whatever price they choose, subject to the constraint of market forces. In the process, it would be more difficult for Federal order auditors to determine if investor-owned proprietary manufacturing plants were returning to producers the appropriate level of pool differential based on higher-valued class sales.
In terms of the step 1 criteria, the pooling differentials option would have a long life because no administrative method for establishing price would be needed. Producers would have more problems understanding how their blend milk price is determined. However, the BFP price used in manufacturing would be market determined just like the inputs used in the production of milk. The price of milk for manufacturing could vary geographically and, for that matter, from plant to plant -- subject, of course, to competitive pressures. In addition to national supply demand conditions for manufactured products, manufacturing milk prices would reflect regional and local conditions.
In evaluating this option in terms of the step 1 criteria, it is questionable whether at least two of the criteria are met. Yet, as in the case of pricing components, this no BFP option involves a basic policy decision that represents a substantial departure from past policy. USC, therefore, moves this option to Step 2 analysis.
Applying the criteria of longevity, understandability, geographic uniformity and reflecting national supply-demand conditions, the following 11 BFP pricing options survived the first analytical step: