REPRESENTATIVE FARMS ECONOMIC
OUTLOOK: FAPRI/AFPC
DECEMBER 1995 BASELINE
AFPC Working Paper 95-21
Edward G. Smith
James W. Richardson
Joe L. Outlaw
Ronald D. Knutson
Allan W. Gray
Steven L. Klose
John W. Miller
Agricultural and Food Policy Center
Department of Agricultural Economics
Texas Agricultural Experiment Station
Texas Agricultural Extension Service
Texas A&M University
December 1995
College Station, Texas 77843-2124
Telephone: (409) 845-5913
Web Site: hhtp:/AFPC1.TAMU.EDU/

REPRESENTATIVE FARMS ECONOMIC
OUTLOOK: FAPRI/AFPC
DECEMBER 1995 BASELINE
Introduction
The farm level economic impacts of the Agricultural Market Transition Act of 1995 (1995
AMTP) on representative crop and livestock producers are projected in this report. The analysis
was conducted over the 1996-2002 planning horizon using AFPC's whole farm simulation
model. Data to simulate farming operations in the nation's major production regions came from
two sources:
- Producer panel interviews to develop economic information to describe
representative crop, livestock, and dairy farms.
- Projected prices from the Food and Agricultural Policy Research Institute (FAPRI)
December 1995 Baseline.
The primary objective of the analysis is to determine the farms' economic viability by
region and commodity over the next seven years, as the 1995 farm bill is implemented.
This report is organized into ten sections. The first section summarizes the provisions of the
1995 farm bill, the panel farm process, key assumptions for the farm level analysis, and a map
showing where the panel farms are located. The second section summarizes the FAPRI
December 1995 Baseline and the policy and price assumptions used for the panel farm analyses.
The third through sixth sections present the results of the simulation analyses for feed grains,
wheat, cotton, and rice farms. The seventh through ninth sections summarize simulation results
for dairy, cattle and hog farms. Two appendices constitute the final section of the report.
Appendix A provides tables which summarize the characteristics for each of the representative
farms. Appendix B provides the names of farmers and land grant faculty who cooperated in the
panel farm process.
Provisions of the 1995 Farm Bill
Provisions in the 1995 AMTP which were important to the farm level analysis are
summarized in Table 1. Major changes from the 1990 farm bill included elimination of target
prices to calculate income support payment rates, decoupling of income support payments,
allowing full flexibility in planting decisions, and eliminating acreage reduction program (ARP)
authority.
Income support payments for cotton, wheat, feed grain, and rice producers will be made to
producers based on 85 percent of their historical base acreage times farm program yield times a
fixed payment rate to be determined based on the number of producers (eligible production) who
enroll in the program and the pool of money available each year for the particular crop.
Planting flexibility was increased from the 15 percent NFA and 10 percent OFA for the
1990 farm bill to 100 percent (Table 1). Producers would be allowed to plant any combination
of program and non-program crops (excluding vegetables) on their farmland without the loss of
fixed payments. The 0/85 and 50/85 provisions in the 1990 farm bill are eliminated under the
1995 farm bill as producers would be eligible to receive their fixed payments and not produce a
crop, i.e., which is roughly equivalent to a 0/100 program.
Panel Farm Process
AFPC has developed and maintains data to simulate 72 representative crop and livestock
farms chosen from major production areas across the United States (Figure 1).
Characteristics for each of the farms in terms of size, crop mix, assets, and average receipts are summarized in
Appendix A. The location of these farms was the result of discussions with staffers for the House
and Senate Agriculture Committees. Information necessary to simulate the economic activity on
these representative farms was developed from panels of producers using a consensus building
interview process. Normally two farms are developed in each region using separate panels of
producers: one is representative of moderate size full-time farm operations, while the second
panel represents farms that are two to three times larger.
The data collected from the panel farms are analyzed in a whole farm simulation model
(FLIPSIM) that was developed by AFPC and has been refined for more than a decade. The
producer panels are provided pro-forma financial statements for their representative farm and are
asked to verify the accuracy of the past year and the reasonableness of a four to five year
projection. Each panel must approve of the model's ability to project economic activity for their
representative farm prior to using the farm for policy analyses.
All farms used in the analysis have been updated with the panels through 1992; using indices
for input costs for 1992-94 the input data were indexed to 1994 conditions. Actual yields and
prices reflective of the representative farms' locations for 1994 are utilized for the present
analyses. FAPRI projections of prices and yields for 1996-2002 are utilized for the baseline
analyses. All of the crop farms are assumed to begin 1994 with 20 percent intermediate- and
long-term debt, based on information provided by ERS-USDA and the panel members. Initial
debt levels for dairy farms were set at 30 percent, while initial debt levels for beef cattle ranches
were 5 percent and initial debt levels for hog farms were 45 percent.
Key Assumptions
- All farms classified as moderate scale are the size (acres or number of livestock)
considered to be representative of a majority of full-time commercial farming operations
in the study area. In many regions, a second farm, two to three times larger than the
moderate scale farm is developed as an indicator of economies of size.
- The farms participate in the farm program and take advantage of
full flexibility provisions in the 1995 farm bill (within
the current crop mix). Crop mix changes from 1995 to
1996 and beyond were estimated based on projected net
returns for each of the enterprises currently produced
on the farms. In several cases, the farm panel indicated that they
would not flex out of their current crop mix due to
rotation and/or other cultural concerns.
- Dairy, hog, and cattle herd sizes are held constant for all farms over the 1994-2002
planning horizon.
- The farm was structured so government payment limits were not effective at reducing
deficiency payments.
- Family living withdrawals were assumed to be a minimum base rate of 10 percent
of gross receipts or $25,000 annually (maximum $100,000) with the farm subject to
owner/operator federal and state income taxes as a sole proprietor.
- No off-farm-related income was included in the analyses.
- Farm program parameters, average annual prices, crop and livestock yield trends,
interest rates, and input cost inflation (deflation) are based on the FAPRI December 1995
Baseline which assumed implementation of the 1995 AMTP.
FAPRI December 1995 Baseline
Projected commodity prices for FAPRI's December 1995 baseline are summarized in
Table 2. Assumed loan rates and annual decoupled
payment rates under the farm program are summarized in Table 3.
FAPRI estimated that the fixed annual payment rates for corn will be
$0.27/bu. in 1996; increase to $0.401/bu. in 1998 and decrease to $0.276/bu. in 2002. Fixed
payment rates for wheat are estimated at $0.677/bu. in 1996 with the payment rate decreasing to
$0.466/bu. in 2002. Cotton's fixed payment rate for 1996 is estimated at $0.0795/lb. and is
projected to decrease to $0.0561/lb. by 2002. The fixed payment rate for rice is projected to be
$1.75/cwt. in 1996; increases to $2.69/cwt. in 1997 and declines to $2/cwt in 2002.
Projected rates of inflation for variable cash expenses by commodity are presented in Table 4.
Annual interest rates paid for long-term and intermediate-term loans and earned for savings are
also summarized in Table 4.
Definitions of Variables in Summary Tables
- Change in Real Net Worth w/o Land, 1996-2002 -- The overall percentage change in the
operator's net worth when land equity is not included, from January 1, 1996 through
December 31, 2002, after adjusting for inflation. This value approximates the real increase or
decrease in earned net worth over the planning horizon.
- Change in Real Net Worth, 1996-2002 -- The overall percentage change in the operator's
net worth from January 1,1996 through December 31, 2002, after adjusting for inflation.
This value reflects the real increase or decrease in net worth or equity for the farm over the
planning horizon.
- Government Payments to Receipts, 1996-2002 --The average value of all government
payments divided by total receipts received from the market plus farm programs (deficiency
payments, decoupled payments, CCC loans, marketing loan gains, and crop insurance
indemnities). The average value in the tables is computed over the seven year planning
horizon.
- Expenses to Receipts, 1996-2002 -- The ratio of all cash expenses divided by total receipts
received from the market place plus farm programs. Cash expenses include interest costs,
fixed cash costs, and variable costs but exclude principal payments, depreciation, income
taxes and family living expenses.
- Average Cash Receipts, 1996-2002 --Gross receipts are cash receipts from market sales,
deficiency payments, decoupled payments, CCC loans, marketing loan gains, crop insurance
indemnities, and other farm related income. The values presented in the tables represent the
average value of total receipts for each year in the planning horizon.
- Average Net Cash Income -- Net cash farm income equals gross receipts minus all cash
production costs including interest payments. Net cash farm income is used to pay family
living expenses, principal payments, income taxes, self employment taxes, and machinery
replacement costs. The values presented in the tables represent the average value of net cash
farm income for each year in the planning horizon.
- Average Government Payments --The average value of all payments received for farm
programs (ie., deficiency payments, transition payments, decoupled payments, CCC loans,
and marketing loan gains) and payments received from crop insurance indemnities. The
values presented in the tables represent the average value of total payments for each year in
the planning horizon.
- Average Total Debt -- Ending debt is the sum of land debt, intermediate-term debt for
machinery and breeding stock, and operating loan carryover at end of the year. The values
presented in the tables represent the average value of total debt for each year in the planning
horizon.
- Average Nominal Net Worth -- Total net worth or equity at the end of each year of in the
planning horizon equals total assets including land minus total debt from all sources. This
value of net worth is not adjusted for inflation and is reported for each year in the planning
horizon.
- NIA for Real Net Worth w/o Land Inflation, 1996-2002 -- Net income adjustment (NIA)
is the annual increase or decrease in net cash farm income necessary to cause the change in
real net worth, excluding land inflation, to equal zero over the planning horizon. If the
change in net worth is negative, the NIA is the annual increase in net income necessary to
prevent a loss in real net worth. NIAs are expressed both as total dollars per year and as a
percent of average annual cash receipts.
- NIA for Total Real Net Worth, 1996-2002 -- Net income adjustment (NIA) is the annual
increase or decrease in net cash farm income necessary to cause the change in total real net
worth, including land inflation, to equal zero over the planning horizon. If the change in net
worth is negative, the NIA is the annual increase in net income to prevent a loss in total real
net worth. NIAs are expressed both as total dollars per year and as a percent of average
annual cash receipts.
Impacts for Representative Farms Producing
Feed Grains

Map of Representative Feed Grain Farms
Figures for Projected Annual Net Cash Farm Income
Table of Results for Feed Grain Farms
Impacts for Representative Farms Producing
Wheat
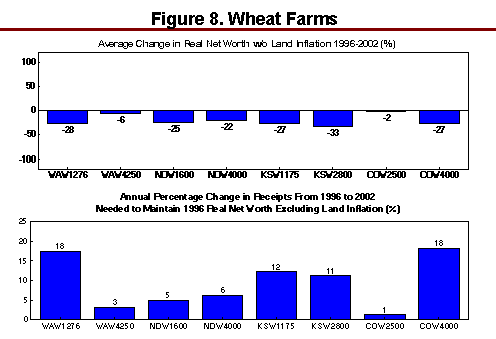
Map of Representative Wheat Farms
Figures for Projected Annual Net Cash Farm Income
Table of Results for Wheat Farms
Impacts for Representative Farms Producing
Cotton
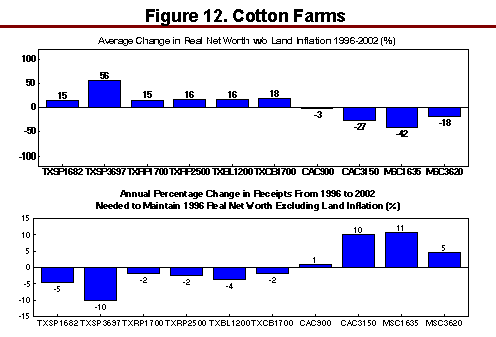
Map of Representative Cotton Farms
Figures for Projected Annual Net Cash Farm Income
Table of Results for Cotton Farms
Impacts for Representative Farms Producing
Rice

Map of Representative Rice Farms
Figures for Projected Annual Net Cash Farm Income
Table of Results for Rice Farms
Impacts for Representative Farms Producing
Milk
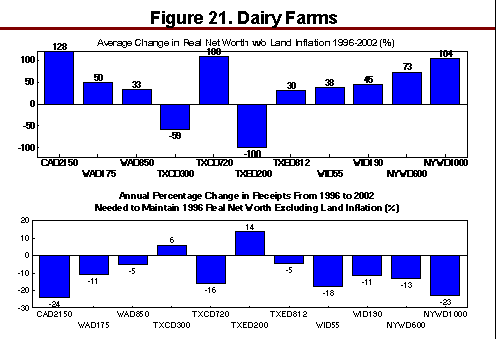

Map of Representative Milk Farms
Figures for Projected Annual Net Cash Farm Income
Tables of Results for Milk Farms
Impacts for Representative Farms Producing
Beef Cattle
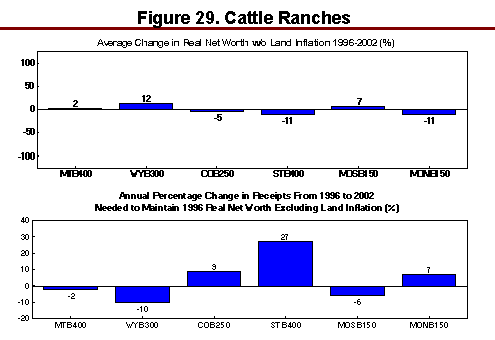
Map of Representative Beef Cattle Farms
Figures for Projected Annual Net Cash Farm Income
Table of Results for Beef Cattle Farms
Impacts for Representative Farms Producing
Hogs

Map of Representative Hog Farms
Figures for Projected Annual Net Cash Farm Income
Table of Results for Hog Farms
APPENDIX A:
CHARACTERISTICS OF
REPRESENTATIVE FARMS
Appendix Tables A1 - A8
APPENDIX B:
LIST OF PANEL FARM
COOPERATORS
Feed Grain Farms
Wheat Farms
Cotton Farms
Rice Farms
Dairy Farms
Beef Producers
Hog Farms